
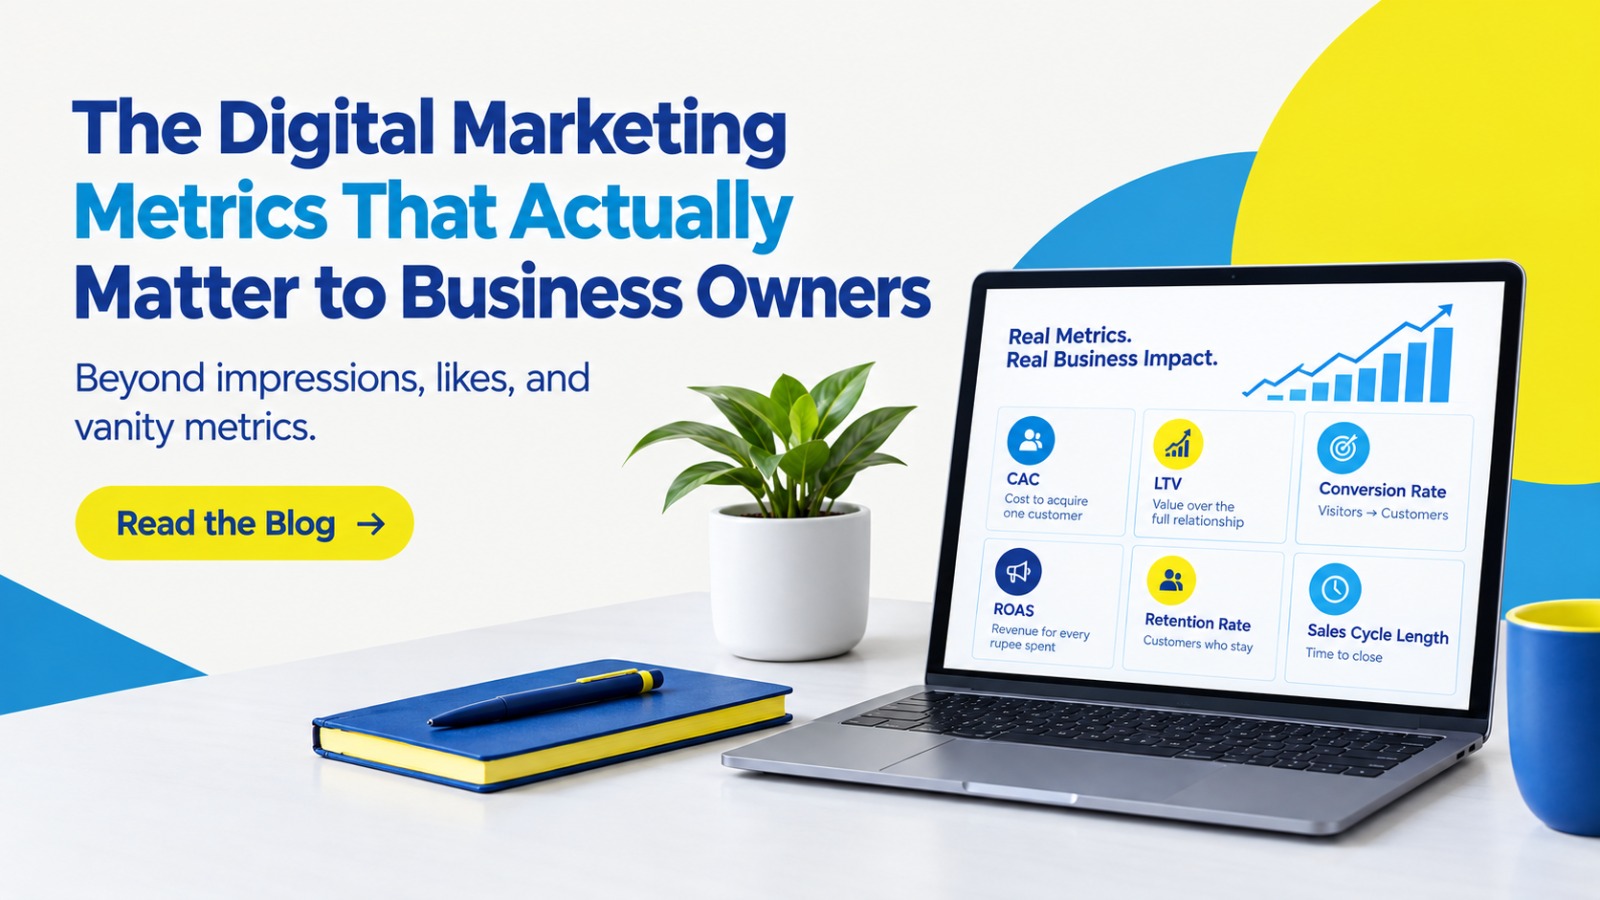
Beyond impressions, likes, and vanity metrics
Most marketing reports lead with the wrong numbers. Impressions went up. Likes doubled. Followers crossed 10,000. None of this tells you if the business grew.
Business owners do not care how many people saw a post. They care if marketing brought in money, saved time, or built something that lasts. Here are the metrics that answer those questions.
1. Customer Acquisition Cost (CAC)
This is what you spend to win one customer. Add up your marketing and sales spend for a period. Divide by the number of new customers in that period.
If your CAC is going up every quarter, you have a problem, even if your follower count looks great. A campaign with a million views and a high CAC is not working. A campaign with ten thousand views and a low CAC is.
2. Customer Lifetime Value (LTV)
This tells you how much a customer is worth over the full relationship, not just the first sale. A customer who buys once and leaves is worth less than one who buys every month for two years.
Compare LTV to CAC. If a customer costs you more to acquire than they will ever spend with you, you are losing money on every sale, no matter how good your reach looks.
3. Conversion Rate
Traffic means nothing if it does not convert. Conversion rate tells you what percentage of visitors take the action you want, a purchase, a form fill, a call booked.
A website with low traffic and a high conversion rate can outperform one with ten times the visitors and a weak conversion rate. Track this at every stage:
• Ad click to landing page
• Landing page to lead
• Lead to customer
4. MQLs to SQLs
Not every lead is a good lead. Marketing qualified leads are people who showed interest. Sales qualified leads are people your sales team believes are ready to buy.
If your MQL number is high but very few turn into SQLs, your marketing is attracting the wrong audience. Fix the targeting, not just the volume.
5. Return on Ad Spend (ROAS)
For every rupee spent on ads, how many rupees came back in revenue. This is simple and direct. A ROAS of 4 means you made four rupees for every one you spent.
Track this by channel and by campaign, not just as one blended number. One channel might be carrying the rest.
6. Customer Retention Rate
New customers are expensive. Existing customers are cheaper to keep than new ones are to find. Retention rate tells you what percentage of customers stay with you over a set period.
A drop in retention often shows up before a drop in revenue. Watch this closely as an early warning signal.
7. Sales Cycle Length
How long does it take from first contact to closed deal. If marketing content is doing its job, this number should shrink over time as leads arrive better informed and more ready to buy.
A long sales cycle with high lead volume often means the content is attracting attention but not building trust fast enough.
Why vanity metrics survive anyway
Vanity metrics are easy to report and easy to feel good about. A rising follower count looks like progress in a weekly update. But it does not answer the one question every business owner is really asking: is this making us money or saving us money.
The metrics above take more effort to track. You need clean data, proper tagging, and a CRM that talks to your marketing platforms. That effort is the difference between a report that impresses and a report that informs.
What to do next
Pick three metrics from this list that map directly to your revenue goals. Track them monthly. Stop leading your reports with impressions and likes. Put CAC, LTV, and conversion rate at the top instead.
Your board, your investors, and your own gut will thank you.